
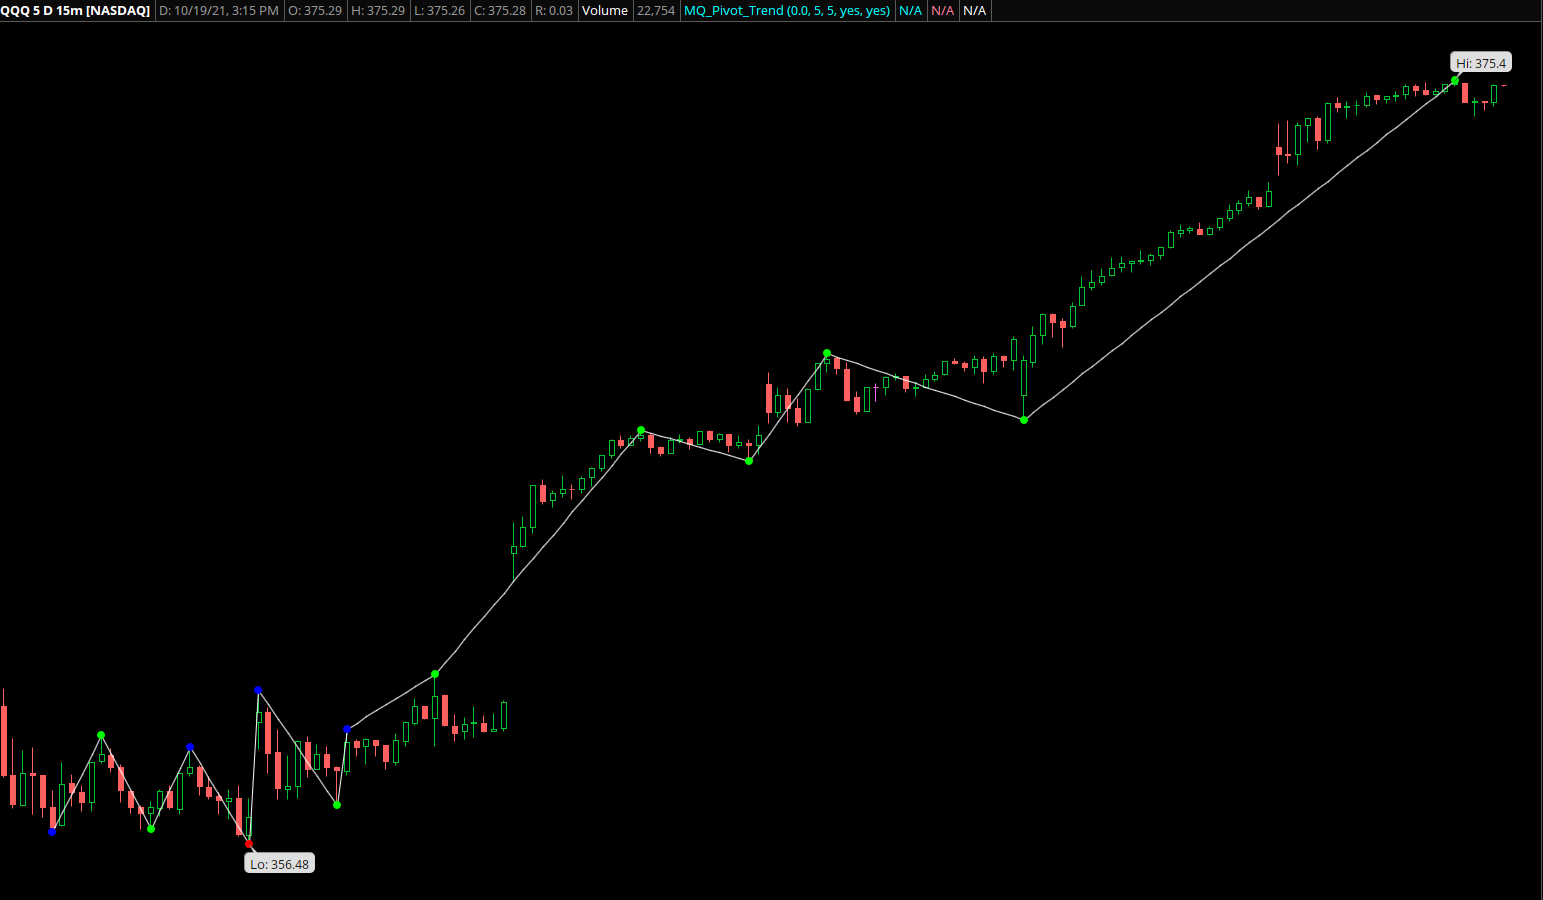
MQ Pivot Trend identifies pivots and compares pivot highs to previous pivot highs, and pivot lows to previous pivot lows, to indicate whether we're trending at each pivot. It reflects trend at each pivot point by coloring the pivots green if trending higher, red if lower, else blue for consolidation / compression. MQ Pivot Trend connects sequential pivots with a trendline. You can see how MQ Pivot Trend appears in the following chart image:
How does MQ Pivot Trend identify a pivot? A pivot stands out as being the extreme of its neighboring bars, the number of which is set by the input, LRStrength. E.g., if LRStrength is 3, then you'll need all 3 bars to the left of a pivot to have a lower high than the current bar, and the following 3 bars' highs must be less than the current bar's high as well, in order to have a pivot. Similarly, to identify a pivot low, the neighboring LRStrength bars must all have higher lows than the current pivot bar.
The number of bars to generate pivots is not dependent on whether it's a 3 min chart or 150 tick chart, etc., Once a sufficient number of bars are available (which would be at least 2xLRStrength+1, you could start to see pivots, if they exist for that LRStrength across the charted bars.
You'll find several videos on our YouTube channel that show MQ Pivot Trend being used to identify potential trade setups. You can see a list of videos featuring MQ Pivot Trend at this link:
https://www.youtube.com/c/basecamptrading/search?query=pivot%20trend
Comments
0 comments
Article is closed for comments.