
If you’re using MQ MZT in thinkorswim, you may find the signals that denote zero-line crossovers to be difficult to see at times. Using thinkorswim’s plot settings, you can increase the size of the carets.
As shown in the following image, you can adjust each of the 4 plots (pointed to with blue arrows in the image) by adjusting the Width (pointed to by a red arrow in the image) of each of the plots up to a value of 5.
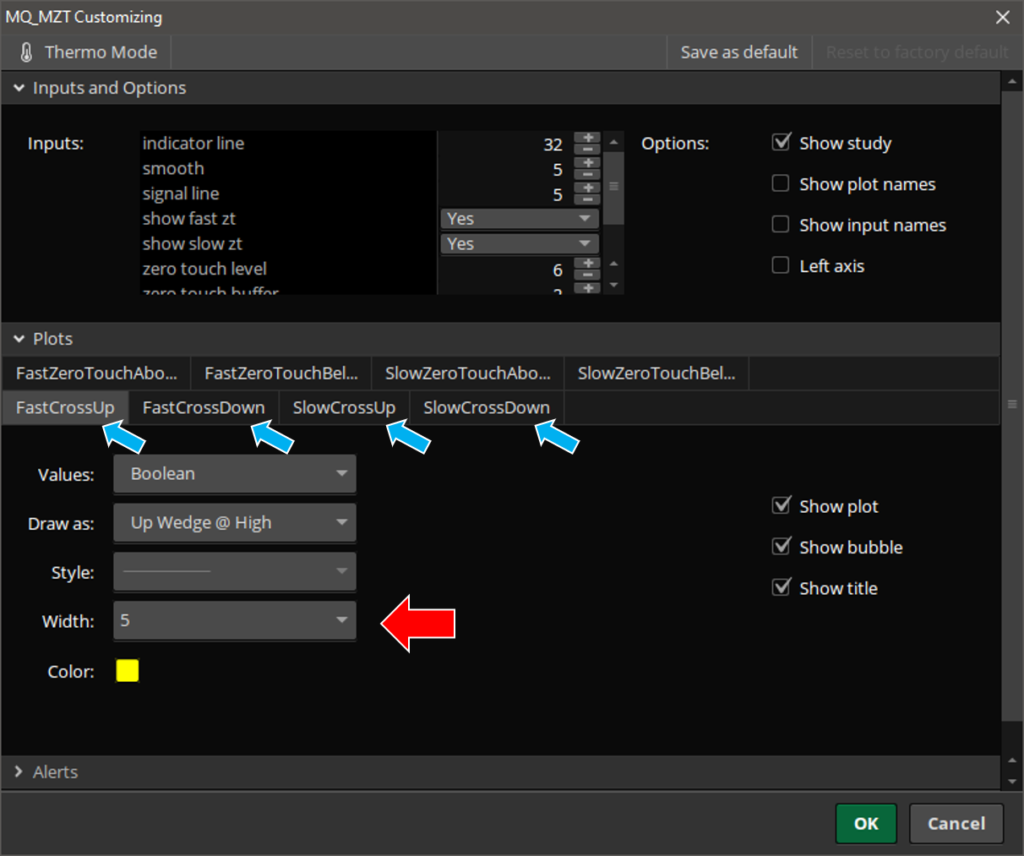
You can also increase the arrow sizes for the Fast and Slow zero touches the same way. Just adjust the 4 plots’ in the top row of plots up to 5.
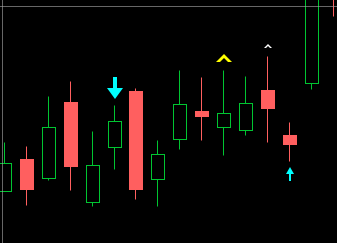
By making this change, you can make both of the plot annotations much larger. The following image shows arrows and carets in both width sizes 5 and 1 so you can compare the difference. Of course, you’ll likely want to make the change across all your crossover plots consistent, though you may find that you don’t need to enlarge the arrows as much as the carets. By default, all of the widths are set to a value of 1.
Comments
0 comments
Article is closed for comments.